One of the biggest challenges of any industry is explaining complex ideas in a way outsiders can understand. Whether a startup is trying to lure investors with a business plan or a department is trying to train other teams on their processes, specialized concepts can get complex and frustrate both the teacher and learner. To prevent this, more people are adding visual aids and graphics to their complex thoughts to break apart their instructions and make them more memorable. Check out these five ways to include them in your next presentation or article.
Images Break Up Text to Aid Comprehension

When audiences are trying to understand complex subjects, it helps to give their brains a break. Long paragraphs of text can lose people, and readers can start skimming and miss important information. To prevent this, add visuals that emphasize the issue or allow readers to take a break.
Think about this next time you’re reading an in-depth article. Your brain relaxes when you look at an image, allowing you to process what you just read. If the image correlates directly with the text, it creates an emotional connection with the data, helping you remember. For example, an image of a homeless teen elicits sadness in an otherwise detailed article about poverty statistics.
Charts and Graphs Help Visual Learners
Everyone learns differently. Some people are visual learners while others prefer to hear or do something to facilitate learning. Some people prefer to read detailed instructions while others enjoy visuals. By utilizing graphics in your instructions, you reduce the risk of miscommunication by tapping into two learning styles.
You don’t have to stop with static graphics. Using videos or interactive media to emphasize your point or educate your audience is an excellent way to increase your results. For instance, introductory or explainer videos can be useful for innovative companies that want audiences to quickly and easily understand the brand’s value proposition.
Graphics Provide Context to Data

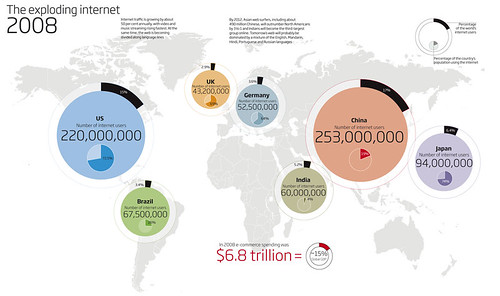
There are some data points that readers can’t comprehend, like large sums of money or distance. In this case, people often use interesting infographics that add perspective and give audiences something to compare them to. One of the most popular visuals is the number of water bottles used each year wrapped around the world. While our brains can’t comprehend the magnitude of billions of water bottles, we can understand how important it is that they can line up around the world several times.
Not only does this provide context, it also adds interest and creates a unique comparison—which also helps with memory.
Images Build Brand Identity
Logos are not the only graphic that companies can use to build their brand. With a growing emphasize on visual content for social platforms, it’s never been more important to have a strong marketing strategy using visual content. Establish an image style for your brand and make sure you are consistent across all communication channels. By pairing your brand with all images that you share, you’ll be able to communicate your message and grow your brand identity.
Images Stay in Your Long-Term Memory
While text stays in your short-term memory—and is more likely to be forgotten after a few hours—images stay in your long-term memory. If you can pair your complex ideas with images, you should be able to remember the concept long after you would if you had just read about it. Furthermore, images travel to the brain faster, so you can understand the message and then move on to learn something else.
This is why professors lecture with slide projectors and images that emphasize their point. They’re able to cover all of the information they need to during the class, and the slides help students remember.
Visuals are a great way to break down complex thoughts to teach them to others and can be applied to almost any idea to make it more understandable.


