
An efficient business report is crucial for any successful project. You may work hard and have awesome achievements. However, if you want the results of your work to be appreciated properly, the report should be impressive. It is not enough just to provide the key ideas and the data of the research. Of course, relevant and reliable data is significant.
Nevertheless, there are several factors that are worth considering in the process of preparing a persuasive presentation of your accomplishments:
- The recipients will be more and longer focused on you and your report if it is designed perfectly;
- The information is accepted and processed faster if it has been structured and looks great
- You have to structure the data properly, think about the suitable type of chart for this data. Moreover, the layout and the choice of fonts also play an important role in the design of the report.
So, there are some useful tips one should know to prepare an outstanding business report. Let us have a look at them, as well as at our templates. We are sure you will find out how to get your report ready in the best possible way.
- Use Easy-To-Understand Visualization
Typically we prepare business reports to view and summarize some data obtained in the process of work. We all know that nothing supports various statements presented in any document better than the objective evidence demonstrated by numbers. Therefore, it is advisable to visualize the data in an engaging way to add credibility to your report. Furthermore, it should be easy to compare, analyze and synthesize.
Opt for the PowerPoint’s Business Infographic Presentation template! In this case, you will definitely create informative charts that will increase your message’s impact on the recipients.
The template has more than 185 unique, multipurpose, creative slides. The content of the slides is different, starting from an opportunity to include portfolios and finishing with timeline and tables. However, the key point is a marvelous handcrafted 3D infographic that is all resizable and editable. You can make the data charts in various forms and colors. Thus, you will showcase your data and give the viewer the most valuable information at the same time.
- Pay Attention to Color Palette
In most cases colors are used to highlight the information presented in table rows or charts. The report will look more impressive if colors are used in headers and footers as background. What is more, it is possible to draw additional attention to some specific information in the report. All you have to do is to put some text in the box with the colored background. Furthermore, it is worth mentioning that your company logo is created in some color combinations. You may use the same colors for various charts, graphs, and lines in your report to reinforce the brand.
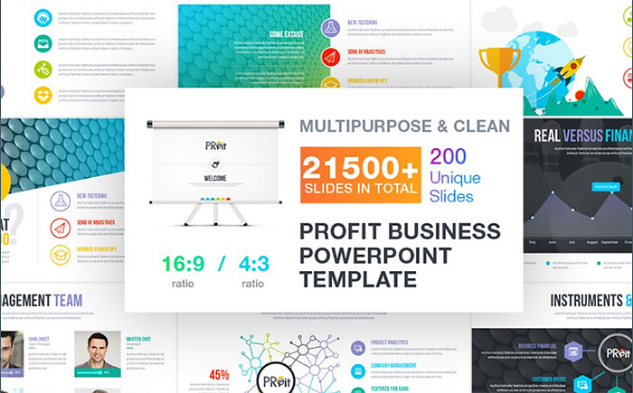
You may also try the Business Plan Presentation PowerPoint template. There are more than 21,500 slides at your disposal, among which you may find 200 unique ones. The theme contains a bright color option with fully editable colors. Do you have questions how to customize it? You will find the answers in the Support File that is included in the template.
- Create a Proper Background
A strong slide background is a key element in your presentation that may either enhance it or distract attention. When we think about creating an ideal background, there are three options to choose from. It can be a picture, some patterns or simply a color.
It is advisable to think about your goals and select the right variant for your slides. For instance, if you use various pictures throughout your presentation, it is better to opt for a solid color background. In case you consider the solid color to be too simple, the patterned background is your choice. Finally, a properly selected background image will add not only color but also style to your document. However, this type of background is more appropriate for presenting the report rather than preparing its hard copy.
In any case, the issue with the background can be solved easily with our Business Infographic – PowerPoint Template. It is a multipurpose template with more than 5600 various slides and more than 200 creative slides of content. Besides, 14 pre-made color schemes with both light and dark backgrounds are waiting for you. The pleasant news is that every section of the slide is completely customizable. Therefore, it allows you to build clean and stylish slides for your report.
- Have a Clear Structure
Structuring your business report is one of the most important steps that will contribute to its success. It does not matter how awesome your ideas are. If they are not structured logically but presented randomly, they will not make the effect you expect.
Therefore, applying either the top-down approach or the bottom-up one to organize your report will work wonders. If you prefer stating the main point at once and then substantiating it with details, use the top-down approach. If you include some data first and mention the key point at the end, the bottom-up approach is your choice.
Any approach will be beneficial, as well as Monthly Planner PowerPoint Template that is ideal for business reports. You will get 50 unique slides. Among them, there are the most popular slides for business, such as SWOT, PEST analysis, Risk Matrix, etc. Opt for this theme to structure your business report to make it successful!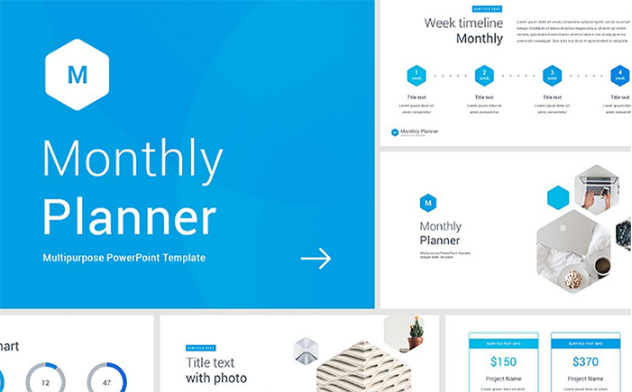
- Do Not Set Tables Aside
Although tables may seem not so exciting as other visual elements, they are excellent for displaying data. Tables are indispensable if you want your recipients to see the individual data points. It is advisable to adjust cell, row, and column dimensions and also data alignment both in rows and columns.
To stir more interest to your tables, you may play with colors. One can add a background color or use various colors to represent the numbers in the best possible way. Or you may save your time and just use Amazing Tables & Dates – PowerPoint Template for your business report.
The tables that are offered there are really fascinating! You can easily take one of the lists or elements from more than 30 unique slides. There are 110 theme colors to choose from. Thus, you will definitely find something for yourself, as well as change color, size, or everything you want.
- Make the Layout as Attractive as Possible
It is hardly possible to underestimate the role of the layout in the business report. A carefully considered layout facilitates a better understanding of the information presented. First, it is advisable to set appropriate margins, taking into account the way your report is submitted or demonstrated.
What is more, pay attention to the individual elements and keep them together. For instance, do not let one row of a table to be placed on the next page. Various elements should be accurately spaced and aligned with each other. It is recommended to use more white space and deliberately align the elements to increase page balance.
Do not want to worry about all this stuff? Delta Multipurpose PowerPoint Template has been specially designed to assist you. Using it, you will definitely make your report skimmable.
As a result, it will be much easier for your recipients to get the main ideas of your report. There are only necessary elements in this template. However, if you want to change something, all of them are easily editable, without Photoshop and Illustrator.
- Choose the Right Fonts for Your Report
It is not a secret that fonts demonstrate the mood and tone of any document. Usually, this encourages people to use as complicated fonts as possible to impress the audience. However, the business report is not the case. It is advisable to consider creative but simple typography that makes the text easier to read.
Moreover, one font style is preferable throughout the report. The report may contain a company logo. In this case, it is not necessary to use the same font that has been applied to the logo. Nevertheless, it is recommended to select the one that conforms to the logo and other elements. And do not misuse the capitalization! It is worth capitalizing something, in case you want to make the point.
Still wondering what fonts to choose? Green Energy – PowerPoint Template is exactly the solution you are looking for! You will work wonders with this professional theme with stylish pixel perfect infographic. And what is the most interesting – it comes with free Google font!
- Do Not Overload the Audience with Information
We tend to think that the more information we include, the better our report is. Thus, we prepare huge text blocks with a lot of details that are difficult to grasp and are, actually, unnecessary. It is recommended to include only one main thought in one paragraph.
In case you have more than one, it will be better to start a new paragraph. Moreover, one-sentence paragraphs are rather the rule than the exception. It is also important to take into account the space between various text elements. Besides, visual cues, such as numbered lists or bullets, will make the text easier to understand.
You may follow this advice and do everything yourself or opt for Annual Report PowerPoint Template. If you want to impress your boss or investors with the professional report, it is obviously your choice! Unique smart objects, 150 colors, 500 free font icons, text and devices slides. Who could ask for more? However, we still have more to offer! Do you want to demonstrate the print version of the report? Two designs are ready to edit and print!
- Embellish the Look of Your Report with Images
If the images are chosen wisely, they will contribute to processing the information presented in the report. The informative product photos or screenshots may persuade the customers to pay more attention to the data you are showing. It goes without saying that they should be relevant to the report. There are some pieces of advice how to choose appropriate pictures.
First of all, try to find real images, not stock ones. Non-traditional images like stylized text or basic images will do good, as well. Secondly, size and resolution are also significant points to take into consideration. It is worth selecting vector images rather than non-vectored ones, as they have better resolution.
You can see it for yourself if you have a look at 2018 Pitch Deck PowerPoint Template. This extravagant template has 100% vector slides with various images that can be customized according to your preferences. You do not need any special software for editing. All you have to do is just to drag and drop images to the appropriate place in your report.

- Guide Your Readers to the Key Data
The last but not the least important point in your business report is navigation. You will help your readers get the main ideas of the report and follow you if you add navigation aids. They are subheads or section titles, page numbers and appendices.
A table of contents may be useful in case the report is rather long or posted online. People may click on the links and go to the necessary part of the report. If you are still looking for a ready-made sample for your report, here is Albireo Keynote Template. It has been designed with all the necessary features that will make the presentation of your report more than impressive.
60 slides with vector elements and various section titles are at your disposal. Moreover, there are 5 pre-made color themes options, as well as dark and light background options. Do you want to change anything? No problem! You may edit text blocks, colors, and graphics in Keynote.
Therefore, business report preparation requires taking pains. However, you can make this process easier and achieve the goal you are pursuing!