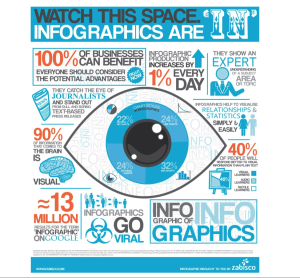
Infographic of Infographics Photo Credit: Sociagility.com
Infographics have been around for quite a while now, in terms of the internet, and have stood the test of time. Depending on who you speak to, some people love them and some people aren’t convinced that they are an effective way to communicate information. If you subscribe to the latter school of thought, we hope to show you what a great tool infographics can be, especially when your audience is the APAC market. It’s not easy to grab the attention of online readers. They are bombarded with so much information all the time; it takes something different to catch their eye. Humans are very visual in nature, which is why images and infographics mixed in with text does a much better job when it comes to engagement than just text alone. Infographics are not only more engaging than text alone, it is easy to gauge measurement in specific markets, they are easily scanned, they have the ability to be social and viral, and you can achieve global coverage.
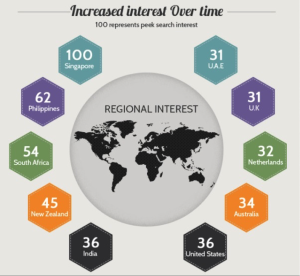
Regional Interest in Infographics
Regional Interest in Infographics Photo Credit: MarketingTechBlog.com
As you can see, depending on the country or region(s) your target audience is in, you might consider using infographics more often in countries that have a high interest in them. As you can see from the infographic above, several APAC countries including Singapore, Philippines, New Zealand, and Australia top the list of high regional interest in reading infographics. Analytics show that the keyword “infographic” is trending in Singapore, Philippines, New Zealand, and Australia. When you target and personalize your content, the result is an increased engagement and return on your investment, as it would be with any other marketing effort.
Infographics Can Be Quickly and Easily Scanned
Everyone is busy these days with limited time and an increased amount of information to consume. Since we are so visual in nature, our eyes are attracted to images and the smaller chunks of texts are also easier to digest visually. In addition to that, the brain retains images at a much higher rate and for longer than text. If you are trying to get information to your audience and you want them to recognize and retain it, then infographics are a great choice.
Infographics are Social and Have the Potential to Be Viral
An infographic, in its very nature, has the potential to increase your reach socially and can even go viral. When you post your infographic on your social channels, it becomes something that can be shared and can then increase your reach, build upon your branding, and establish your authority. In addition to that, the added benefit is that it is a commodity that links back to your website.
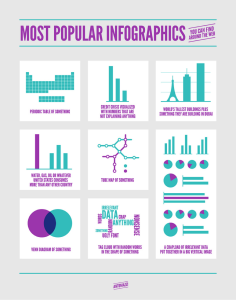
Most Popular Infographics
Most Popular Types of Infographics Photo Credit: Sociagility.com
There are different ways to present your information in infographic form including charts, bar graphs, pie charts, and more. The key is to finding the right way to present it in a unique, clever, engaging, and dynamic way. Any information you have to share can be turned into an infographic.
Takeaways: How Can You Make Your Dynamic with Infographics?
Now that you see that creating infographics and using them to present your data to your target audience is a good idea, what’s next? Research the different types of infographics there are and grab ideas that you like and think you can apply to your own business. Start brainstorming ideas on how you can present the information or data you want as an infographic. Use your own design team, hire a professional, or learn how to make your own infographic. There are different tools available to generate and create bar graphs and charts customized with your own information. Just as with any campaign, be sure to test out different options before fully releasing your design and seek out feedback from your customers or clients to ensure that they understand the message you are trying to send and see how well it is received.


