One question we have gotten from our retail clients for years at The Search Monitor is: “How does my ad spend on SEM compare to the average for my retail category, and to other retail categories?” Yes, there is a lot of free data out there that has attempted to answer this question. But it’s free for a reason. It just isn’t precise. If a search marketer wanted the good stuff, the top-shelf accurate data that leads to smart business decisions, it usually required a significant amount of work to find and assemble the data. Then, the question was always: “Can I really trust this?”
The Search Monitor came a long way in addressing the issue of inaccurate SEM data this year when we partnered with comScore and gained full access to their amazingly rich database of online measurement data.
The Search Monitor crawls the web regularly and knows what advertisers are running on search engines, where the ads run, how often and when they run, and lots of other helpful data. But comScore provided the post-click perspective that added the color commentary that our clients desperately need to make smarter decisions.
The comScore data set is deep (lots of history), broad (lots of categories), varied (lots of different metrics), and incredibly precise and reliable (it comes from a large trust-worthy data set).
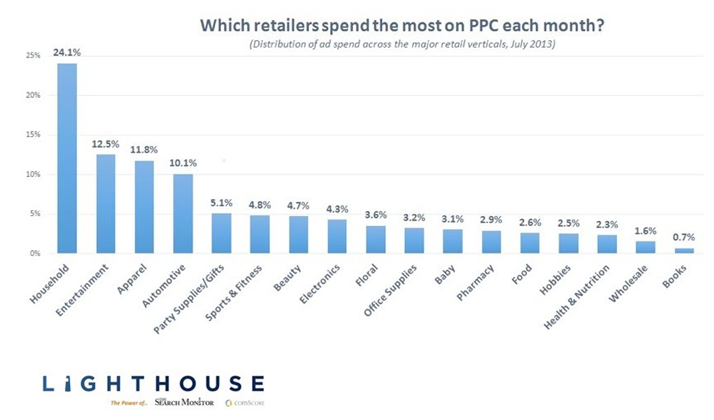
So now, onto the question at hand. We wanted to find out how ad spend differed by retailer. We used Lighthouse (which is the name of our product combining data from us and comScore) to assemble categories for the 17 major retail categories. For these categories, we pulled one very interesting stat: average SEM advertising spend. The data was from July 2013, the most recent month of data in our system.
The findings are below:
We didn’t expect things like:
- There to be such a difference across the categories
- Such high spend in the Household Products category
- Electronics to be only in the middle of the chart
While our team was surprised with how the ad spending is distributed among retail verticals, we’d be curious to see how other search marketing experts interpret this data. What do you think are the implications for search marketers in these different retail verticals? What other ways could this data be sliced and diced to learn even more?


