Somehow, it always seems to be analytics season in the world of search marketing. Either you’re setting up a campaign, optimizing it, or reporting on its performance.
One of the most useful metrics our Search Monitor clients use when it’s time to dive into AdWords or AdCenter is competitive ad spend. If you’re scratching your temple and wondering how you could possibly know what your competition spends, you’re not alone. While it takes considerable effort to develop precise spend estimates, it is very much possible thanks to the power of screen-crawling technology, carefully tuned algorithms, and our new best friend, Big Data.
Competitive ad spend intelligence helps you answer the big C-level question: What it will take for my company to maintain (or grow) our PPC market share? Agencies and consultants love having this data, especially when it comes from an independent 3rd-party. It becomes suddenly much easier for them to successfully request extra budget from their clients.
You’d be surprised how much companies spend on PPC each month. Revenue attribution is relatively easy to obtain for PPC vs. most other channels, so when a desirable ROI is identified, it’s easier to convince a company’s bean counters to loosen the PPC purse strings.
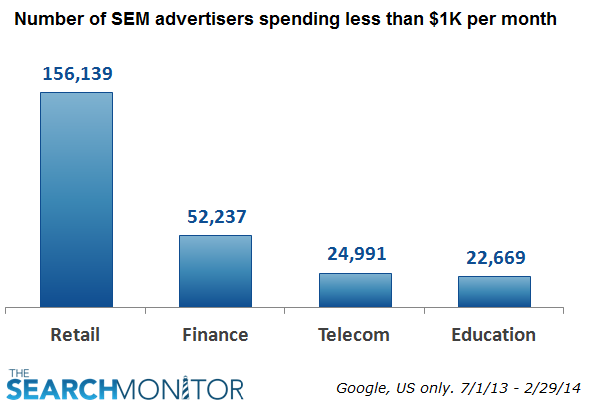
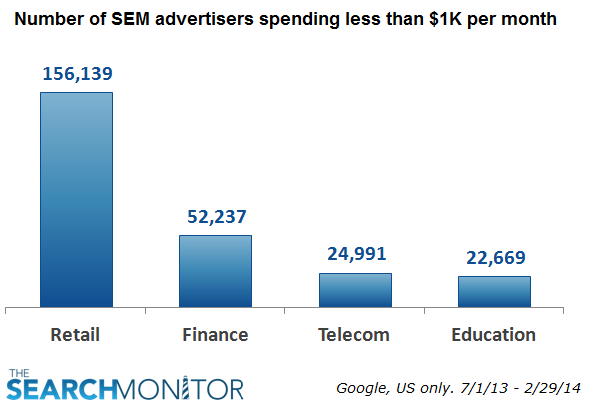
We decided to dig into The Search Monitor’s ad spend database to compare ad spend across 4 large verticals for PPC: Finance, Retail, Telecom, and Education. We looked at Google searches in the US from July 2013 through February 2014. Here are two charts we found most interesting, but please contact us if you’s like to see more.
The chart above shows just how crowded and competitive PPC is for retailers, especially in the smaller budget arena. Our data shows that there are more than 150,000 retail advertisers spending less than $1,000 per month on Google’s PPC properties, including mobile. When you compare the average order value of retail versus the other 3 verticals profiled, it makes sense that they would be spending less. For reference,our technology monitored 161,954 total advertisers in retail, so the vast majority spend less than $1k each month.
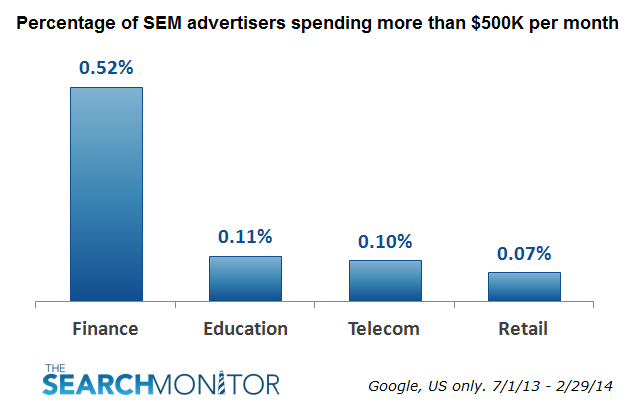
Now let’s look at the other end of the ad spend spectrum, the high rollers:
This chart looks at the percentage of advertisers in each vertical that spend more than $500K per month on Google’s PPC properties. Eye-opening, right? While the percentages are small, it’s clear that many financial search marketers have very large monthly ad budgets. For reference, the 0.52% figure for Finance above represents just 25 advertisers.
Search marketers in the insurance sub-vertical help keep these budgets high, as keywords like ‘Life Insurance’, Vehicle Insurance, and ‘Liability Insurance’ have some of the most expensive CPCs around. (A recent Search Monitor report showed that average CPCs for ‘Liability Insurance’ keywords were around $52!)
Next time you’re asked if you’re spending too much on PPC, watch what happens to the conversion when you pull your competitors’ ad spend out of your back pocket. Making the case for increasing PPC spend will be that much easier!


